By Priya Raman · Updated November 8, 2026 · 7 min read
Short answer
A chiller log sheet should capture chilled and condenser water temperatures, refrigerant pressures, compressor amps, approach temperatures, superheat and subcooling, oil data and run hours at the same operating point each time. The value is in the trend: a slow drift in approach, amps or pressure shows fouling, leaks or wear weeks before an alarm does.
A chiller log sheet should record the readings that describe heat transfer, refrigerant condition and compressor load: entering and leaving water temperatures on both loops, evaporator and condenser pressures, saturation and actual temperatures, compressor amps, oil data and run hours. Take them at a similar load each time, write down the load, and compare against the start-up baseline. One reading means little. A series of readings shows the machine changing long before a safety trips.
Why keep a chiller log at all?
Modern chillers have controllers that display or store most of these values, so a paper or spreadsheet log can look redundant. It is not, for three reasons.
- Controllers show now, logs show then. Many panels keep only a short history. A log you control lets you compare this month with last summer.
- Humans notice what alarms do not. An alarm fires at a set limit. A person reading a trend sees the approach temperature climbing two degrees over a season and asks why.
- A log is evidence. When a problem appears, a clean history shortens troubleshooting and supports warranty and maintenance discussions.
If the controller exports trends automatically, use that. The principle is the same: the same points, recorded consistently, reviewed by someone who knows what normal looks like. For context on the machine itself, see how a chiller works.
What should be on the log sheet?
Group the readings by system so the sheet is quick to fill out and easy to scan.
| Group | Readings | What it tells you |
|---|---|---|
| Chilled water | Entering and leaving temperature, flow or pump status, differential pressure across the evaporator | Load, flow and evaporator condition |
| Condenser side | Entering and leaving water temperature (or ambient air temperature for air-cooled), differential pressure across the condenser | Heat rejection and condenser fouling |
| Refrigerant | Evaporator and condenser pressure, saturation temperatures, suction temperature, discharge temperature, liquid line temperature | Charge, restrictions and compressor behavior |
| Calculated | Evaporator approach, condenser approach, superheat, subcooling | Heat exchanger health and charge level |
| Electrical | Compressor amps per phase, volts, percent load or capacity step | Load, motor condition and imbalance |
| Oil | Oil pressure or differential, oil level, oil temperature, sump heater status | Lubrication health |
| Run data | Run hours, starts, setpoint, alarms or faults since last log | Wear, cycling and history |
| Conditions | Date, time, outdoor temperature, operator initials, notes | Context for comparing entries |
Add a “notes” column and use it. “Condenser tubes cleaned today” or “tower fan replaced” explains a step change in the data later.
How do you calculate approach, superheat and subcooling?
These calculated values are more useful than raw pressures because they cancel out much of the load and weather effect.
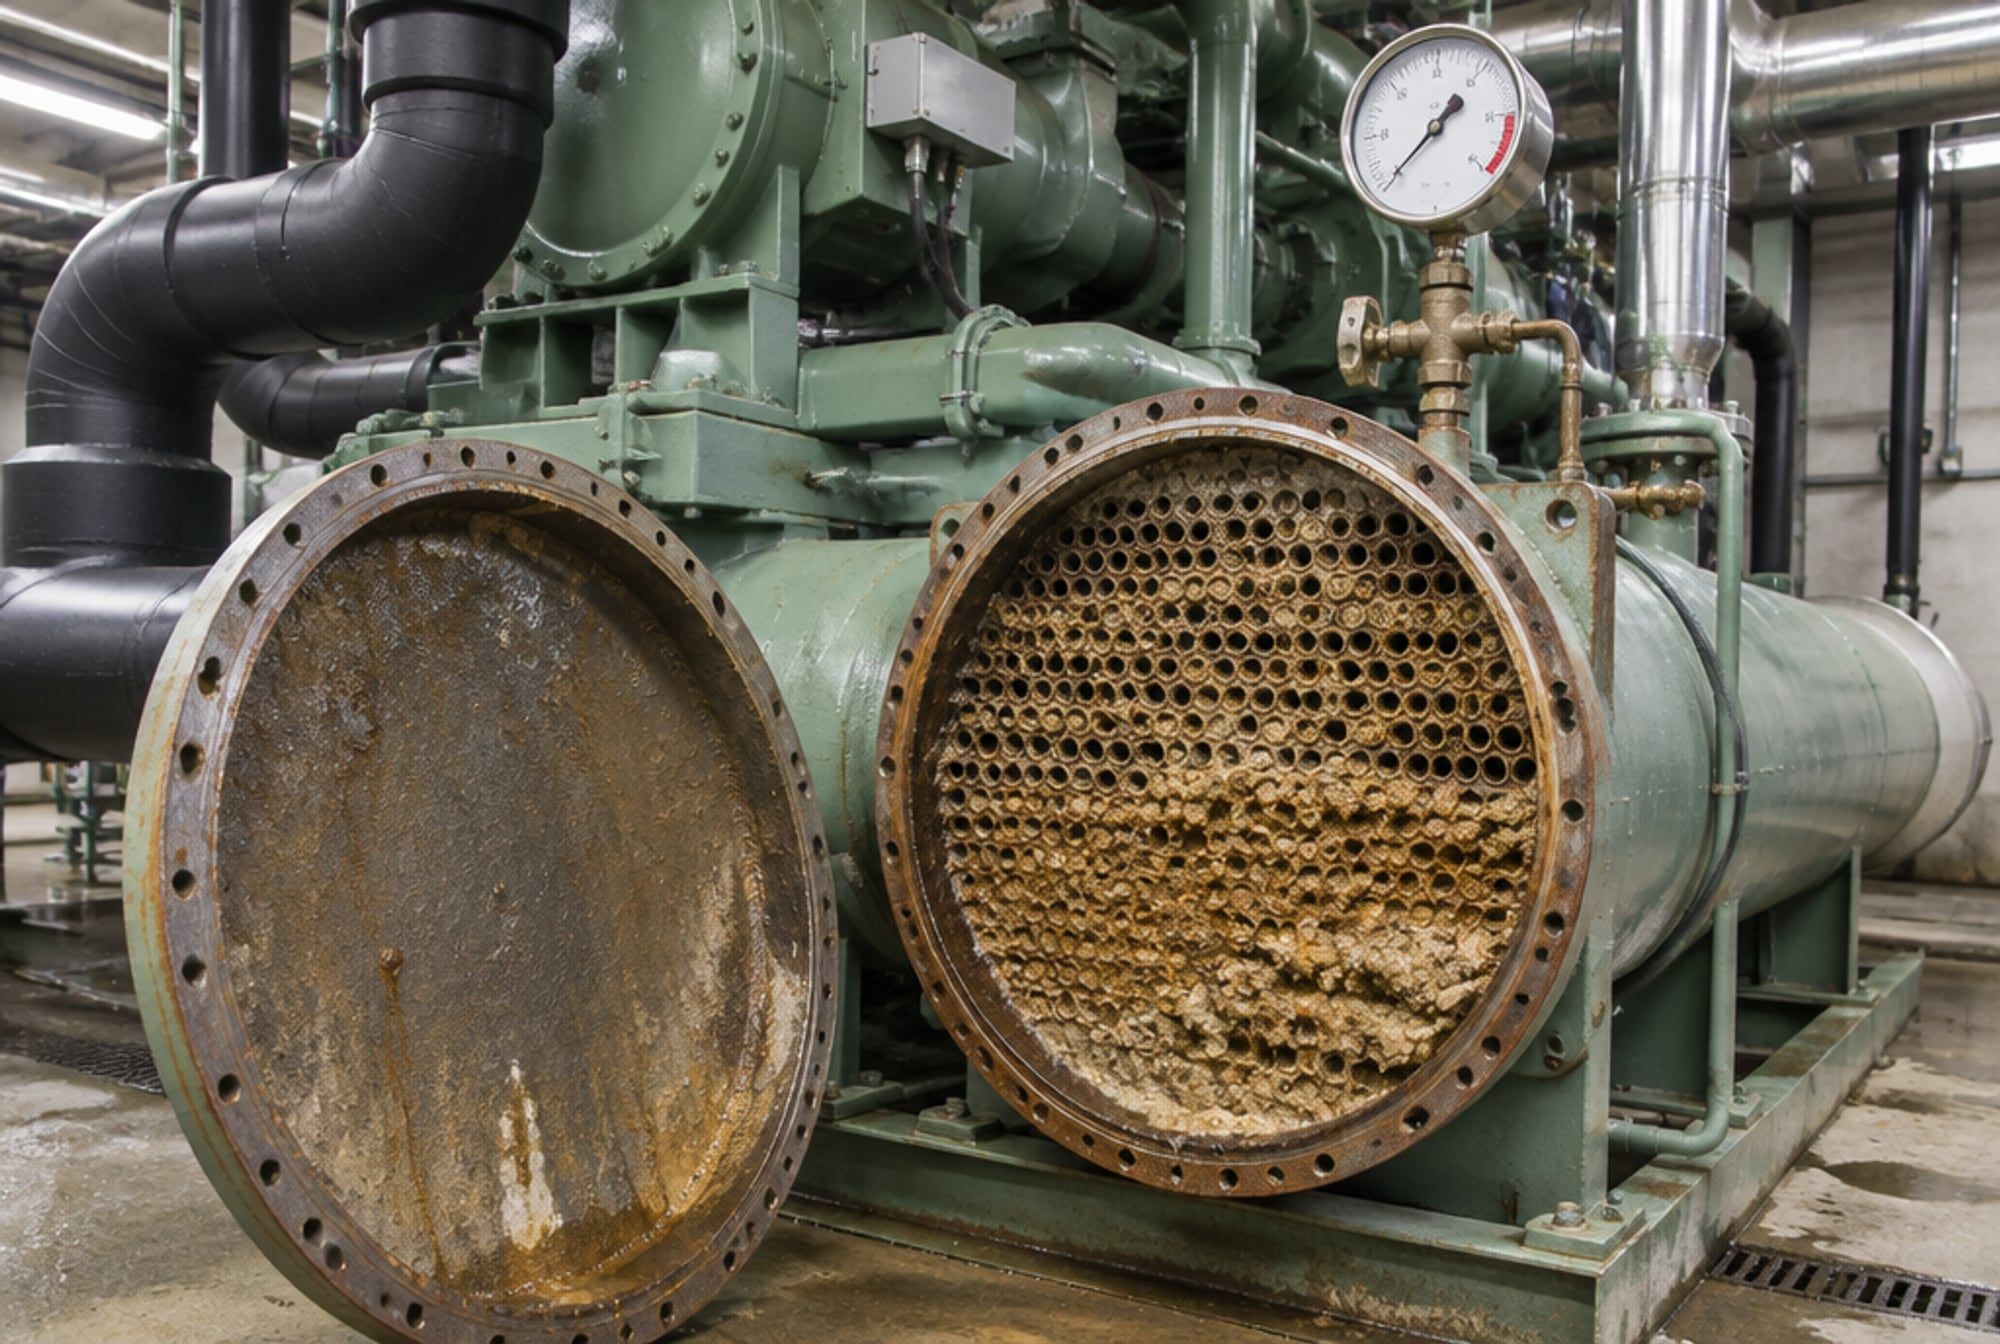
- Evaporator approach is the leaving chilled water temperature minus the refrigerant saturation temperature in the evaporator. A rising approach often points to fouled evaporator tubes, poor flow or a refrigerant or oil issue.
- Condenser approach is the refrigerant saturation temperature in the condenser minus the leaving condenser water temperature. A rising value often points to fouled condenser tubes, non-condensables or low flow. See chiller high pressure trips for the downstream effect.
- Superheat is the suction gas temperature minus the evaporator saturation temperature at that pressure. Too low can mean liquid is returning toward the compressor. Too high can mean the evaporator is starved. On flooded designs, superheat behaves differently, so use the manufacturer’s expected range.
- Subcooling is the condenser saturation temperature minus the liquid line temperature. Low subcooling can indicate a low charge. Very high subcooling can indicate overcharge or liquid backing up in the condenser.
Saturation temperature comes from the pressure reading and the refrigerant’s pressure-temperature data, so the log must note which refrigerant is in the machine. Many controllers calculate saturation temperature for you. Confirm what your controller displays rather than assuming.
How often should you record readings?
There is no single schedule that suits every plant. A practical way to think about it:
- Daily or every shift for critical plants, such as data halls, hospitals or process lines where a failure is costly. Many controllers and building automation systems can trend the same points continuously.
- Weekly for ordinary comfort cooling during the cooling season.
- At start-up and shutdown of the season, with a fuller reading set and a note on any maintenance done.
- After any change: a repair, a refrigerant top-up, a water treatment change, a setpoint change or a controls update.
The manufacturer’s operation and maintenance manual often lists a recommended frequency and the list of points. Follow it where it is stricter. A tighter routine is also reasonable during peak summer load, which is when marginal condensers and towers show their problems. See chiller maintenance checklist for the work that sits alongside the log.
How do you use the log to spot problems early?
Record at a comparable load, then watch for direction and rate of change rather than a single number.
- Set a baseline. Capture a full set during commissioning or after a major service, at several load points if possible. Everything later is compared with it.
- Normalize for load and weather. Compare readings taken near the same percent load and similar condenser entering temperature.
- Plot the key values. Condenser approach, evaporator approach, amps per ton or percent load, and discharge temperature are good candidates. Even a simple spreadsheet chart works.
- Look for slow drift and sudden steps. Drift suggests fouling or wear. A step suggests an event, such as a valve, a control change or a failed component.
- Cross-check related readings. High condenser approach with normal tower performance points toward the chiller side. High approach on both sides may mean water treatment or flow issues.
Examples of patterns worth a closer look:
- Condenser approach creeping up over weeks: tube fouling or scale. See water treatment basics.
- Evaporator approach rising with falling chilled water delta-T: flow, fouling or refrigerant side issues.
- Amps rising at the same load and temperatures: mechanical wear, higher lift or a problem elsewhere in the cycle.
- Amps unbalanced between phases: an electrical supply or motor issue to investigate promptly.
- Oil level or oil differential changing: a lubrication concern. See what oil analysis tells you.
- Starts per hour climbing: short cycling, which may relate to sizing or controls. See chiller sizing basics.
What are common log sheet mistakes?
- Recording at random loads, which makes trends unreadable.
- Copying the previous line without taking a reading.
- Skipping units or the refrigerant type.
- Logging readings but never reviewing them.
- Writing only “OK” in place of a number.
- Changing instruments or sensors without a note. A replaced gauge can look like a process change.
Frequently asked questions
Do I still need a manual log if the chiller has a controller?
Often yes, or at least a periodic export. Controllers can have limited memory, and a deliberate log forces someone to look at the machine and the plant room. If the building automation system trends the same points automatically, that can replace handwriting, as long as someone reviews it on a schedule.
What is the most important single reading to log?
No single reading tells the full story, but condenser and evaporator approach temperatures are among the most informative, because they reflect heat exchanger condition regardless of weather and load. Compare them with amps and run hours for the full picture.
What should I do if a reading is outside the normal range?
Confirm the reading first, because instruments drift and gauges stick. Then check related values, compare with the baseline and review recent changes. Consult the manufacturer’s manual and a qualified refrigeration technician with the proper Texas credentials for corrective work. Work on refrigerant circuits in Texas is regulated, as covered in TDLR inspections and complaints.
SpecServis engineers in Ukraine work with industrial chillers and refrigeration plants. We are planning to enter the Central Texas market and are looking for technicians, partners and a company to buy. See our open positions or partnership options.